Learning Objectives:
At the end of the lesson, learners should be able to:
- Identify the location and geography of Kyrgyzstan
- Understand how to add and customize a map using ArcGIS JavaScript API,
- Understand how to add markers and popups to a map using ArcGIS JavaScript API,
- Understand how to add and change the base map of a map using ArcGIS JavaScript API.
Overview:
In this tutorial, we will go through the code that creates a map using the ArcGIS API for JavaScript and displays three markers on the map. The markers represent different locations in Kyrgyzstan, each with a different color, symbol, and popup window that displays a description and an image.
Requirements:
- A code editor such as Visual Studio Code, Sublime Text, Notepad++ or your favorite code editor.
- A web browser such as Google Chrome or Mozilla Firefox or your favorite browser.
- Basic knowledge of HTML, CSS, and JavaScript.
Step 1: Set up the HTML document
The first thing we need to do is to create an HTML document that includes the necessary scripts and stylesheets. The code starts with the <!DOCTYPE html> declaration, which tells the browser that we are using HTML5.
<!DOCTYPE html>
<html>
<head>
  <meta charset="utf-8">
  <meta name="viewport" content="initial-scale=1, maximum-scale=1, user-scalable=no">
  <title>ArcGIS Maps SDK for JavaScript - Basic</title>
  <link rel="stylesheet" href="https://js.arcgis.com/4.25/esri/themes/light/main.css">
  <script src="https://js.arcgis.com/4.25/"></script>
  <style>
    html, body, #viewDiv {
      padding: 0;
      margin: 0;
      height: 100%;
      width: 100%;
    }
  </style>
</head>
<body>
  <div id="viewDiv"></div>
</body>
</html>
This code is a basic HTML file that includes links to the ArcGIS Maps SDK for JavaScript CSS and JavaScript libraries, as well as a map container and two div elements for the title and legend. It also includes a script tag for adding JavaScript code to create the map and display earthquake data. The api-key parameter in the ArcGIS API script tag needs to be replaced with a valid ArcGIS API key.
Step 2: Load the ArcGIS Maps SDK for JavaScript modules
The next step is to load the necessary modules from the ArcGIS Maps SDK for JavaScript. We do this by using the require function, which takes an array of module names and a callback function as arguments.
<script>
  require([
    "esri/Map",
    "esri/views/MapView",
    "esri/Graphic",
    "esri/layers/GraphicsLayer",
    "esri/widgets/BasemapToggle",
    "esri/widgets/BasemapGallery",
    "esri/widgets/Expand"
  ], function(Map, MapView, Graphic, GraphicsLayer, BasemapToggle, BasemapGallery, Expand) {
    // Code goes here
  });
</script>
In this code, we are loading seven modules:
- Map: A class that represents a map in the ArcGIS API for JavaScript.
- MapView: A class that represents a 2D view of a map.
- Graphic: A class that represents a graphic element on a map, such as a marker or a line.
- GraphicsLayer: A class that represents a layer of graphics on a map.
- BasemapToggle: A widget that allows the user to switch between two basemaps.
- BasemapGallery: A widget that displays a collection of basemaps that the user can choose from.
- Expand: A widget that can be used to expand and collapse other widgets.
We pass these module names as strings in an array to the require function. We also define a callback function that takes the corresponding class names as arguments. We will use these class names to create objects later in the code.
Step 3: Create a map and view
The next step is to create a map and view, which will be used to display the graphics layer we just created.
First, we create a new instance of the Map class, passing in an object that specifies the basemap property. In this example, we set the basemap to “hybrid”, which is a combination of satellite imagery and streets.
var map = new Map({
  basemap: "hybrid"
});
Next, we create a new instance of the MapView class, passing in an object that specifies the container, map, center, and zoom properties. The container property specifies the ID of the HTML element that will contain the map, which in this case is “viewDiv”. The map property specifies the map that the view will display, which is the map instance we just created. The center property specifies the initial center point of the view, which is an array of longitude and latitude coordinates. In this example, we set the center point to Bishkek, the capital city of Kyrgyzstan. The zoom property specifies the initial zoom level of the view, which determines the scale at which the map is displayed. In this example, we set the zoom level to 8.
var view = new MapView({
  container: "viewDiv",
  map: map,
  center: [74.59, 42.87], // set center to Bishkek
  zoom: 8 // zoom to scale level 8
});
Finally, we add the graphics layer we created earlier to the map using the add() method. map.add(graphicsLayer);
map.add(graphicsLayer);Step 4: Create and add markers and popups to a map
The next step 4 creates three markers representing different locations in Kyrgyzstan and adds them to a graphics layer.
1.First, we create a new graphic object for the city of Bishkek:
var bishkekMarker = new Graphic({: 2.Second, we set the geometry of the Bishkek marker to a point with the specified longitude and latitude:
geometry: {type: "point", longitude: 74.604047, latitude: 42.875486 } 3.We set the marker symbol to a red simple marker with a white outline:
symbol: { type: "simple-marker", color: "red", size: "16px", outline: { color: "#ffffff", width: "3px" } } 4.Next is set the popup template for the Bishkek marker with a title and content. The content includes an image and a description of the city:
popupTemplate: { title: "Bishkek City", content: "<img src='https://tinypic.host/images/2023/03/27/mountains-g396b6c471_640.jpg' alt='Image'><br><br><b>Description:</b> Bishkek is the capital city of Kyrgyzstan and is known for its vibrant culture and history. Visitors to the city can explore museums and art galleries or stroll through the streets to admire the architecture" }5.Finally, we add the Bishkek marker to the graphics layer:
graphicsLayer.add(bishkekMarker); Steps 1-5 are repeated for the Burana marker and the Issyk-kul Lake marker, with different coordinates, colors, and popup templates.
The description of the markers and a link to their images:
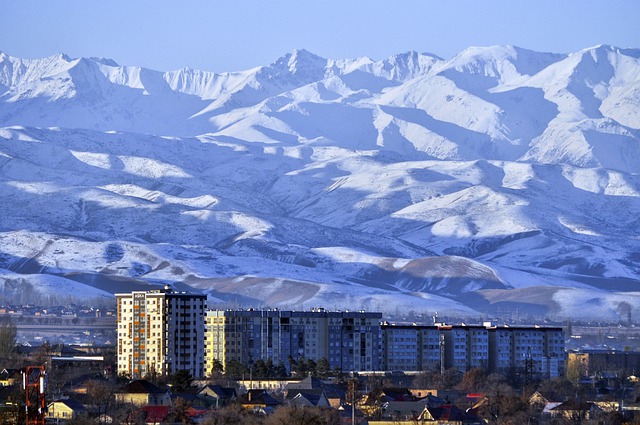
Bishkek City

Bishkek is the capital city of Kyrgyzstan and is known for its vibrant culture and history. Visitors to the city can explore museums and art galleries or stroll through the streets to admire the architecture.
Image URL: https://tinypic.host/images/2023/03/27/mountains-g396b6c471_640.jpg
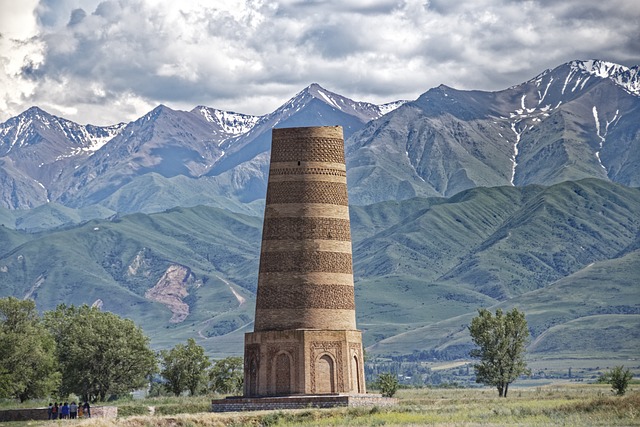
Burana Tower

The Burana Tower is an ancient minaret located in the Chuy Valley, near the city of Tokmok. The tower dates back to the 11th century and is one of the few remaining structures from the Karakhanid Empire. Visitors to the tower can climb to the top for stunning views of the surrounding countryside.
Image URL: https://tinypic.host/images/2023/03/27/kyrgyzstan-g45433eeca_640.jpg
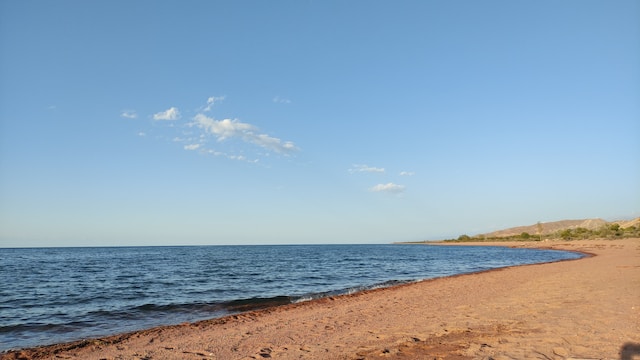
Ussyk-Kul Lake

Issyk-Kul is the second-largest alpine lake in the world and is located in the eastern part of Kyrgyzstan. The lake is known for its crystal clear waters and stunning mountain scenery. Visitors to Issyk-Kul can swim in the lake, explore the local towns and villages, or hike in the nearby mountains.
Image URL: https://tinypic.host/images/2023/03/27/yuliya-yevseyeva-FLbVJ4NsnfM-unsplash.jpg
Note: All images used in this tutorial are hosted on TinyPic, a free image hosting service. While this can be a convenient way to share images for personal use, it’s worth noting that there are potential disadvantages to using third-party image hosting services. These can include issues with image quality, reliability, and privacy. As always, it’s important to carefully consider the benefits and drawbacks of any tool or service before using it for your own projects. If you’d like to learn more about TinyPic you can check out this URL address: https://tinypic.host/
Note: As for copyright and resources, the code includes comments which specify the source of the images used in the popup templates, as well as the source of the vector basemaps. It is important to ensure that any images or resources used in your web map are properly licensed and credited to their original source.
Step 5: Add and change the base map of a map
In this step, we add a basemap toggle. In additional we add a BasemapGallery widget which displays a gallery of available basemaps. This widget is added to an Expand widget, which allows the user to expand or collapse the gallery as needed. The Expand widget is then added to the view using the view.ui.add() method.
1.First add a BasemapToggle widget which allows the user to switch between different basemaps (e.g. satellite imagery, streets, etc.). It is added to the view using the view.ui.add() method.
var basemapToggle = new BasemapToggle({ view: view, nextBasemap: "hybrid" });2.After we create a basemap gallery widget with a reference to the map view and sets the source to the ArcGIS portal with vector basemaps:
var basemapGallery = new BasemapGallery({ view: view, source: { portal: { url: "https://www.arcgis.com", useVectorBasemaps: true } } });: The following resource you can find a complete list of base maps provided by ArcGIS JavaScript API and detailed information on how to use them.
https://developers.arcgis.com/javascript/latest/api-reference/esri-Map.html#basemap
3.Next we create an expand widget for the basemap gallery with a reference to the map view, the basemap gallery widget, and sets it to be collapsed by default:
var bgExpand = new Expand({ view: view, content: basemapGallery, expanded: false });4.Finally we add the basemap gallery expand widget to the top right corner of the map view UI.
view.ui.add(bgExpand, "top-right").Step 6: Final step. Save HTML
Finally, the code ends with an HTML element which specifies where the map will be displayed on the web page. Save the HTML file and open it in your favorite web browser. Next you can find full code:
Note: that the code also includes comments which explain what each section of code does. These comments are denoted by the // symbol.
<!DOCTYPE html>
<html>
  <head>
    <meta charset="utf-8">
    <meta name="viewport" content="initial-scale=1, maximum-scale=1, user-scalable=no">
    <title>ArcGIS API for JavaScript - Basic</title>
    <link rel="stylesheet" href="https://js.arcgis.com/4.25/esri/themes/light/main.css">
    <script src="https://js.arcgis.com/4.25/"></script>
    <style>
      html, body, #viewDiv {
        padding: 0;
        margin: 0;
        height: 100%;
        width: 100%;
      }
    </style>
    <script>
      require([
        "esri/Map",
        "esri/views/MapView",
        "esri/Graphic",
        "esri/layers/GraphicsLayer",
        "esri/widgets/BasemapToggle",
        "esri/widgets/BasemapGallery",
        "esri/widgets/Expand"
      ], function(Map, MapView, Graphic, GraphicsLayer, BasemapToggle, BasemapGallery, Expand) {

        var map = new Map({
          basemap: "hybrid"
        });

        var view = new MapView({
          container: "viewDiv",
          map: map,
          center: [74.59, 42.87], // set center to Bishkek
          zoom: 8 // zoom to scale level 8
        });

        var graphicsLayer = new GraphicsLayer();
        map.add(graphicsLayer);

        var bishkekMarker = new Graphic({
          geometry: {
            type: "point",
            longitude: 74.604047,
            latitude: 42.875486
          },
          symbol: {
            type: "simple-marker",
            color: "red",
            size: "16px",
            outline: {
              color: "#ffffff",
              width: "3px"
            }
          },
          //Image by Eldiiar Isakov from Pixabay
          popupTemplate: {
            title: "Bishkek City",
            content: "<img src='https://tinypic.host/images/2023/03/27/mountains-g396b6c471_640.jpg' alt='Image'><br><br><b>Description:</b> Bishkek is the capital city of Kyrgyzstan and is known for its vibrant culture and history. Visitors to the city can explore museums and art galleries or stroll through the streets to admire the architecture"
          }
        });
        graphicsLayer.add(bishkekMarker);

        var buranaMarker = new Graphic({
          geometry: {
            type: "point",
            longitude: 75.334277,
            latitude: 42.732954
          },
          symbol: {
            type: "simple-marker",
            color: "green",
            size: "16px",
            outline: {
              color: "#ffffff",
              width: "3px"
            }
          },
          //Image by Makalu from Pixabay, url: https://pixabay.com/images/id-4770365/
          popupTemplate: {
            title: "Burana",
            content: "<img src='https://tinypic.host/images/2023/03/27/kyrgyzstan-g45433eeca_640.jpg' alt='Image'><br><br><b>Description:</b> The Burana Tower is an ancient minaret located in the Chuy Valley, near the city of Tokmok. The tower dates back to the 11th century and is one of the few remaining structures from the Karakhanid Empire. Visitors to the tower can climb to the top for stunning views of the surrounding countryside."
          }
        });
        graphicsLayer.add(buranaMarker);

        var IssykkulMarker = new Graphic({
          geometry: {
            type: "point",
            longitude: 77.170152,
            latitude: 42.387738
          },
          symbol: {
            type: "simple-marker",
            color: "blue",
            size: "16px",
            outline: {
              color: "#ffffff",
              width: "3px"
            }
          },
          //Photo by Yuliya Yevseyeva on Unsplash url:
          popupTemplate: {
            title: "Issyk-kul Lake",
            content: "<img src='https://tinypic.host/images/2023/03/27/yuliya-yevseyeva-FLbVJ4NsnfM-unsplash.jpg' alt='Image'><br><br><b>Description:</b> Issyk-Kul is the second-largest alpine lake in the world and is located in the eastern part of Kyrgyzstan. The lake is known for its crystal clear waters and stunning mountain scenery. Visitors to Issyk-Kul can swim in the lake, explore the local towns and villages, or hike in the nearby mountains."
          }
          });
          graphicsLayer.add(IssykkulMarker);
          var basemapToggle = new BasemapToggle({
          view: view,
          nextBasemap: "hybrid"
        });

        // Create the BasemapGallery widget
        var basemapGallery = new BasemapGallery({
          view: view,
          source: {
            portal: {
              url: "https://www.arcgis.com",
              useVectorBasemaps: true  // Load vector tile basemaps
            }
          }
        });

        // Create an Expand widget for the BasemapGallery
        var bgExpand = new Expand({
          view: view,
          content: basemapGallery,
          expanded: false
        });
      view.ui.add(bgExpand, "top-right");

      });
    </script>
  </head>
  <body>
    <div id="viewDiv"></div>
  </body>
</html>Conclusion
In this lesson, learners have been introduced to the basics of the ArcGIS API for JavaScript. They have learned how to create a map, add markers with popups to it, and toggle between different basemaps. The lesson has also covered how to create a BasemapGallery and BasemapToggle widgets to enhance the functionality of the map. By the end of this lesson, learners should be familiar with the fundamental concepts of creating maps using the ArcGIS API for JavaScript.
Some of the key concepts covered from this lesson include:
- How to create a map with the ArcGIS API for JavaScript
- How to add markers with popups to a map
- How to toggle between different basemaps using the BasemapToggle widget
- How to create a BasemapGallery widget to provide users with a range of basemap options
To further explore and expand on the concepts covered in this lesson, learners can refer to the following resources:
- ArcGIS API for JavaScript Documentation: https://developers.arcgis.com/javascript/latest/
- ArcGIS API for JavaScript Documentation Sample: https://developers.arcgis.com/javascript/latest/sample-code/
- ArcGIS Online Help: https://developers.arcgis.com/javascript/latest/community/#follow-us-on-twitter
- Esri Training: https://www.esri.com/training/

