Learning Objectives:
At the end of the lesson, learners should be able to:
- Identify the location and geography of Kyrgyzstan
- Understand how to add and customize a map using Leaflet
- Understand how to add markers and popups to a map
- Understand how to add and change the base map of a map
Overview:
Leaflet is a popular open-source JavaScript library for creating interactive maps on the web. It provides an easy-to-use API that makes it simple to add markers, popups, and various other features to your map. With Leaflet, you can display map data from various sources, such as OpenStreetMap, Google Maps, or your own custom tilesets. In this tutorial, we’ll explore the basics of using Leaflet to create an interactive map with custom markers and popups. We’ll also take a look at how to switch between different base maps and add a layer control to our map.
Requirements:
- A code editor such as Visual Studio Code, Sublime Text, Notepad++ or your favorite code editor.
- A web browser such as Google Chrome or Mozilla Firefox
- Basic knowledge of HTML, CSS, and JavaScript
Step 1: Create a new HTML file
Create a new HTML file and save it with a name of your choice. In this example, we will name it index.html. Add the following code to the HTML file:
<!DOCTYPE html>
<html>
<head>
	<title>Leaflet - Basic</title>
	<meta charset="utf-8" />
	<meta name="viewport" content="width=device-width, initial-scale=1.0">
	<link rel="stylesheet" href="https://cdnjs.cloudflare.com/ajax/libs/leaflet/1.9.1/leaflet.css" />
	<style>
		html, body {
			height: 100%;
			margin: 0;
		}
		#map {
			width: 100%;
			height: 100%;
		}
	</style>
</head>
<body>
<div id="map"></div>
<script src="https://cdnjs.cloudflare.com/ajax/libs/leaflet/1.9.1/leaflet.js"></script>
<script>
	// Leaflet code will go here
</script>
</body>
</html>
This HTML code sets up the basic structure for your Leaflet map, including a container for the map, a link to the Leaflet CSS file, and a link to the Leaflet JavaScript file.
Step 2: Set up the map container
1.First, we set up the container for your Leaflet map. Add the following JavaScript code inside the <script> tags in your HTML file:
// Initialize the map
var map = L.map('map').setView([42.70, 74.53], 7);
This code initializes the map and sets the initial view to a specific location and zoom level. In this example, the location is set to [42.70, 74.53] which is the latitude and longitude of the city of Bishkek, Kyrgyzstan. The zoom level is set to 7, which is a good starting point for viewing a larger region.
2.Next, we can add one or more base map layers to the map using the L.tileLayer() function. This function takes a URL template and options for the layer.For example, to add the OpenStreetMap standard layer, you can use the following code:
var osm = L.tileLayer('https://{s}.tile.openstreetmap.org/{z}/{x}/{y}.png', {
    attribution: '© <a href="https://www.openstreetmap.org/">OpenStreetMap</a> contributors'
}).addTo(map);
This code creates a new tile layer object with a URL template that points to the OpenStreetMap tile server, and adds it to the map object. The attribution option specifies the attribution text that will be displayed on the map.
3.We can add additional base maps by creating new L.tileLayer() objects with different URL templates and options. For example:
var OpenStreetMap_Mapnik = L.tileLayer('https://tile.openstreetmap.org/{z}/{x}/{y}.png', {
    maxZoom: 19,
    attribution: '© <a href="https://www.openstreetmap.org/">OpenStreetMap</a> contributors'
});
var Stadia_OSMBright = L.tileLayer('https://tiles.stadiamaps.com/tiles/osm_bright/{z}/{x}/{y}{r}.png', {
    maxZoom: 20,
    attribution: '© <a href="https://stadiamaps.com/">Stadia Maps</a>, © <a href="https://openmaptiles.org/">OpenMapTiles</a> © <a href="http://openstreetmap.org">OpenStreetMap</a> contributors'
});
var CartoDB_DarkMatter = L.tileLayer('https://{s}.basemaps.cartocdn.com/dark_all/{z}/{x}/{y}{r}.png', {
    attribution: '© <a href="https://www.openstreetmap.org/">OpenStreetMap</a> contributors © <a href="https://carto.com/attributions">CARTO</a>',
    subdomains: 'abcd',
    maxZoom: 20
});
var Stamen_Watercolor = L.tileLayer('https://stamen-tiles-{s}.a.ssl.fastly.net/watercolor/{z}/{x}/{y}.{ext}', {
    attribution: 'Map tiles by <a href="http://stamen.com">Stamen Design</a>, <a href="http://creativecommons.org/licenses/by/3.0">CC BY 3.0</a> — Map data © <a href="https://www.openstreetmap.org/">OpenStreetMap</a> contributors',
    subdomains: 'abcd',
    minZoom: 1,
    maxZoom: 16,
    ext: 'jpg'
});
	var USGS_USImagery = L.tileLayer('https://basemap.nationalmap.gov/arcgis/rest/services/USGSImageryOnly/MapServer/tile/{z}/{y}/{x}', {
		maxZoom: 20,
		attribution: 'Tiles courtesy of the <a href="https://usgs.gov/">U.S. Geological Survey</a>'
	});
4. Lastly, we create a baseMaps object that contains all the different base map layers that we want to include in our map. This object uses the names of the layers as keys and the layers themselves as values.
	var baseMaps = {
		"OpenStreetMap": OpenStreetMap_Mapnik,
		"Stadia OSM Bright": Stadia_OSMBright,
		"CartoDB Dark Matter": CartoDB_DarkMatter,
		"Stamen Watercolor": Stamen_Watercolor,
		"USGS US Imagery": USGS_USImagery
	};
5.We then create a L.control.layers control and add it to the map. This control takes in the baseMaps object we just created and creates a set of radio buttons that allow the user to switch between different base maps.
L.control.layers(baseMaps).addTo(map);The following resource you can find a complete list of base maps provided by Leaflet and detailed information on how to use them.
https://leaflet-extras.github.io/leaflet-providers/preview/
Step 3: Add markers with popups
Now that we have our map and base layers set up, let’s add some markers to the map with popups that show additional information about the locations. In this example, we’ll add three markers with popups.
1.First, we’ll create the markers Djengish Chokusu using the L.marker() method and passing in the coordinates for each location. We’ll then use the .addTo(map) method to add the markers to the map.
var marker1 = L.marker([42.036136, 80.129324]).addTo(map);2.Next, we use the .bindPopup() method to add a popup to each marker. The popup content is defined as an HTML string, which we create by using a combination of text and images. We also add some custom styling to the popup container and the image to ensure that it displays correctly on the map.
marker1.bindPopup("<div class='popup-container'><h4>Djengish Chokusu</h4><img class='popup-image' src='https://tinypic.host/images/2023/03/27/landscape-gf0257ef8c_640.jpg' /><p>Jengish Chokusu, also known as Peak Pobeda, is the highest peak in the Tian Shan mountain range, located on the border between Kyrgyzstan and China. Standing at 7,439 meters tall, it is one of the most challenging peaks for mountaineers to climb. Despite its difficulty, it is a popular destination for experienced climbers seeking a thrilling adventure in one of the most beautiful mountain ranges in the world.</p>");3.Steps 1 and 2 are repeated for the Tashrabat marker and the Canyon Skazka markers, with different coordinates, colors, and Popup.
The description of the markers and a link to their images:
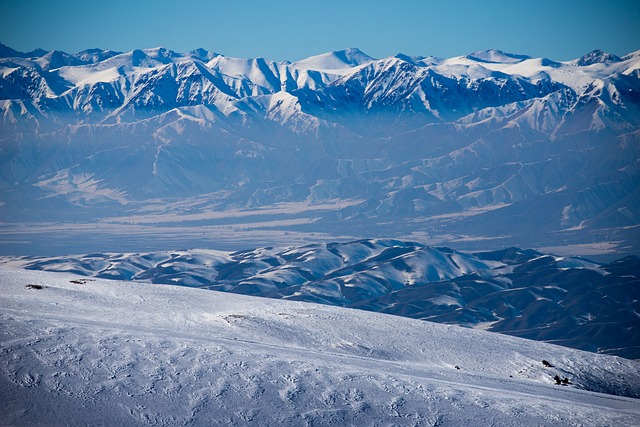
Jengish Chokusu

Jengish Chokusu, also known as Peak Pobeda, is the highest peak in the Tian Shan mountain range, located on the border between Kyrgyzstan and China. Standing at 7,439 meters tall, it is one of the most challenging peaks for mountaineers to climb. Despite its difficulty, it is a popular destination for experienced climbers seeking a thrilling adventure in one of the most beautiful mountain ranges in the world.
Image URL : https://tinypic.host/images/2023/03/27/landscape-gf0257ef8c_640.jpg
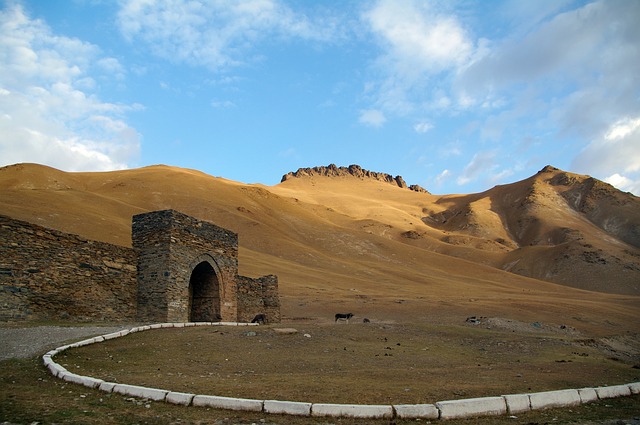
Tahrabat

Tashrabat, also known as Stone Rabat, is a historic caravanserai located in the southern part of Kyrgyzstan. The structure dates back to the 15th century and was used as a resting place for travelers along the Silk Road. Visitors to Tashrabat can explore the ancient building and learn about the history of the Silk Road.
Image URL: https://tinypic.host/images/2023/03/27/kirghizia-gda7e3e8d3_640.jpg
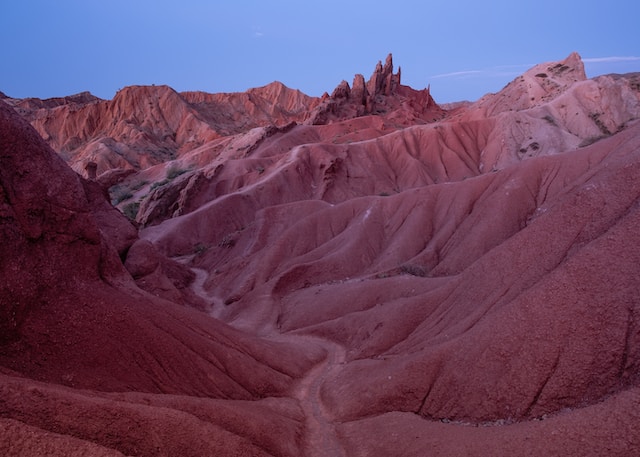
Canyon Skazka

Canyon Skazka, also known as the Fairy Tale Canyon, is a unique geological formation located in the Issyk-Kul region. The canyon is known for its colorful rock formations, which resemble fairy tale characters. Visitors to the canyon can hike through the stunning landscape and admire the unique rock formations.
Image URL: https://tinypic.host/images/2023/03/27/aydin-hassan-AQakIZ2G4IM-unsplash.jpg
Note: Regarding copyright of the images, the code comments include information about the source of each image and a URL where the image can be found. It’s important to check the copyright status of each image and ensure that you have permission to use it in your web application.
Note: All images used in this tutorial are hosted on TinyPic, a free image hosting service. While this can be a convenient way to share images for personal use, it’s worth noting that there are potential disadvantages to using third-party image hosting services. These can include issues with image quality, reliability, and privacy. As always, it’s important to carefully consider the benefits and drawbacks of any tool or service before using it for your own projects. If you’d like to learn more about TinyPic you can check out this URL address: https://tinypic.host/
Step 4: Final step. Save HTML
Finally, the code ends with an HTML element which specifies where the map will be displayed on the web page.
Note that the code also includes comments which explain what each section of code does. These comments are denoted by the // symbol.
<!DOCTYPE html>
<html>
<head>
	<title>Leaflet - Basic</title>
	<meta charset="utf-8" />
	<meta name="viewport" content="width=device-width, initial-scale=1.0">
	<link rel="stylesheet" href="https://cdnjs.cloudflare.com/ajax/libs/leaflet/1.9.1/leaflet.css" />
	<style>
		html, body {
			height: 100%;
			margin: 0;
		}
		#map {
			width: 100%;
			height: 100%;
		}
		.popup-container {
		max-width: 300px; /* set maximum width of popup container */
		}

		.popup-image {
		max-width: 100%;
		height: auto;
		}
	</style>
</head>
<body>
<div id="map"></div>

<script src="https://cdnjs.cloudflare.com/ajax/libs/leaflet/1.9.1/leaflet.js"></script>
<script>
	// Initialize the map
	var map = L.map('map').setView([42.70, 74.53], 7);

	// Add base map layers
	var osm = L.tileLayer('https://{s}.tile.openstreetmap.org/{z}/{x}/{y}.png', {
			attribution: '© <a href="https://www.openstreetmap.org/copyright">OpenStreetMap</a>'
		}).addTo(map);

	var OpenStreetMap_Mapnik = L.tileLayer('https://tile.openstreetmap.org/{z}/{x}/{y}.png', {
		maxZoom: 19,
		attribution: '© <a href="https://www.openstreetmap.org/copyright">OpenStreetMap</a> contributors'
	});
	var Stadia_OSMBright = L.tileLayer('https://tiles.stadiamaps.com/tiles/osm_bright/{z}/{x}/{y}{r}.png', {
		maxZoom: 20,
		attribution: '© <a href="https://stadiamaps.com/">Stadia Maps</a>, © <a href="https://openmaptiles.org/">OpenMapTiles</a> © <a href="http://openstreetmap.org">OpenStreetMap</a> contributors'
	});
	var CartoDB_DarkMatter = L.tileLayer('https://{s}.basemaps.cartocdn.com/dark_all/{z}/{x}/{y}{r}.png', {
		attribution: '© <a href="https://www.openstreetmap.org/copyright">OpenStreetMap</a> contributors © <a href="https://carto.com/attributions">CARTO</a>',
		subdomains: 'abcd',
		maxZoom: 20
	});
	var Stamen_Watercolor = L.tileLayer('https://stamen-tiles-{s}.a.ssl.fastly.net/watercolor/{z}/{x}/{y}.{ext}', {
		attribution: 'Map tiles by <a href="http://stamen.com">Stamen Design</a>, <a href="http://creativecommons.org/licenses/by/3.0">CC BY 3.0</a> — Map data © <a href="https://www.openstreetmap.org/copyright">OpenStreetMap</a> contributors',
		subdomains: 'abcd',
		minZoom: 1,
		maxZoom: 16,
		ext: 'jpg'
	});
	var USGS_USImagery = L.tileLayer('https://basemap.nationalmap.gov/arcgis/rest/services/USGSImageryOnly/MapServer/tile/{z}/{y}/{x}', {
		maxZoom: 20,
		attribution: 'Tiles courtesy of the <a href="https://usgs.gov/">U.S. Geological Survey</a>'
	});
	// Add base map layer control
	var baseMaps = {
		"OpenStreetMap": OpenStreetMap_Mapnik,
		"Stadia OSM Bright": Stadia_OSMBright,
		"CartoDB Dark Matter": CartoDB_DarkMatter,
		"Stamen Watercolor": Stamen_Watercolor,
		"USGS US Imagery": USGS_USImagery
	};
	L.control.layers(baseMaps).addTo(map);

	// Add markers with popup
	// Image by SLioy19 from Pixabay, url https://pixabay.com/images/id-5597553/
	var marker1 = L.marker([42.036136, 80.129324]).addTo(map);
	marker1.bindPopup("<div class='popup-container'><h4>Djengish Chokusu</h4><img class='popup-image' src='https://tinypic.host/images/2023/03/27/landscape-gf0257ef8c_640.jpg' /><p>Jengish Chokusu, also known as Peak Pobeda, is the highest peak in the Tian Shan mountain range, located on the border between Kyrgyzstan and China. Standing at 7,439 meters tall, it is one of the most challenging peaks for mountaineers to climb. Despite its difficulty, it is a popular destination for experienced climbers seeking a thrilling adventure in one of the most beautiful mountain ranges in the world.</p>");

	// Image by Walter Frehner from Pixabay, url:https://pixabay.com/images/id-5129659/
	var marker2 = L.marker([40.875314, 75.268655]).addTo(map);
	marker2.bindPopup("<div class='popup-container'><h4>Tashrabat</h4><img class='popup-image' src='https://tinypic.host/images/2023/03/27/kirghizia-gda7e3e8d3_640.jpg' /><p>Tashrabat, also known as Stone Rabat, is a historic caravanserai located in the southern part of Kyrgyzstan. The structure dates back to the 15th century and was used as a resting place for travelers along the Silk Road. Visitors to Tashrabat can explore the ancient building and learn about the history of the Silk Road.</p></div>");

	// Image by Aydin Hassan on Unsplash, url: https://unsplash.com/photos/AQakIZ2G4IM?utm_source=unsplash&utm_medium=referral&utm_content=creditShareLink
	var marker3 = L.marker([42.156379, 77.354346]).addTo(map);
	marker3.bindPopup("<div class='popup-container'><h4>Canyon Skazka</h4><img class='popup-image' src='https://tinypic.host/images/2023/03/27/aydin-hassan-AQakIZ2G4IM-unsplash.jpg' /><p>Canyon Skazka, also known as the Fairy Tale Canyon, is a unique geological formation located in the Issyk-Kul region. The canyon is known for its colorful rock formations, which resemble fairy tale characters. Visitors to the canyon can hike through the stunning landscape and admire the unique rock formations.</p>");

</script>
</body>
</html>Conclusion
In this lesson, learners were introduced to Leaflet, a JavaScript library for interactive maps. They learned how to create and customize a map by adding base layers, markers, and popups. The lesson covered different types of base layers, including OpenStreetMap, Stadia OSM Bright, CartoDB Dark Matter, Stamen Watercolor, and USGS US Imagery. The learners also learned how to add markers to the map and attach popups containing additional information such as images, text, and links.
Some of the key concepts covered in this lesson include:
- Initializing a map with a specific location and zoom level
- Adding base layers to the map using different tile providers
- Creating markers and binding popups to them with additional information
- Styling popups with custom CSS
By following the examples and code provided in this lesson, learners will have a basic understanding of how to use Leaflet to create interactive maps for their web projects. For more information and examples, check out the Leaflet documentation and community resources.
- Leaflet documentation: https://leafletjs.com/
- Leaflet documentation on markers: https://leafletjs.com/examples/custom-icons/
- Leaflet documentation on layer groups and layers control :https://leafletjs.com/examples/layers-control/
- Leaflet Sample: https://leafletjs.com/examples.html
- Leaflet providers preview: Leaflet-providers preview

